AWS News Blog
Rapid Auto Scaling with Amazon SQS
|
|
Earlier this month an AWS user named Andy emailed the following question to me:
We’re interested in using the number of items in our sqs queue as criteria for autoscaling our ec2 workers. The 5 minute delay is really way too long for this application, it would have to keep track of the queue in close to real time, 1 minute or less. Is this possible?
Well, Andy, that’s a great question! In fact, the SQS team asked me to write about that very topic earlier this month. Thanks for providing me with the perfect introduction to this blog post.
Defining the Problem
Before jumping in, let’s spend a few minute defining the problem that Andy faces. As you can read in the Scaling Based on Amazon SQS tutorial in the Auto Scaling documentation, you can use the number of messages stored in an Amazon SQS queue as an indicator of the amount of work that is waiting in line for eventual processing within an Auto Scaling Group comprised of a variable number of EC2 instances. Each SQS queue reports a number of metrics to CloudWatch at five minute intervals, including ApproximateNumberOfMessagesVisible. If your workload is spikey in nature, you may want to build an application that can respond more quickly to changes in the size of the queue.
You may also have an application that pulls work from multiple queues distributed across two or more AWS Regions. Since the metrics are collected on a per-queue, per-Region basis, additional work is needed in order to create a metric that accurately reflects the actual amount of pending work.
Solving the Problem
You can address either (or both) of these challenges by using a custom CloudWatch metric. The finished solution will use a pair of Auto Scaling Groups. The first Group (which I will call the Checker) will periodically check the queue depth and publish it as a custom metric. The second Group (the Worker) will do the actual processing of the messages in the queue, scaling up and down using the information provided by the custom metric.
The Checker Group exists in order to keep a single, modestly-sized EC2 instance up and running (a t2.micro will probably suffice), and to launch replacements if necessary (set the minimum and maximum number of instances to 1 for the Group). This instance periodically runs some simple code that is responsible for pulling the ApproximateNumberOfMessagesVisible metrics from one or more queues and publishing the results to a custom CloudWatch metric. Here are a couple of code snippets to get you started. The first step is to query SQS to retrieve the metric:
public static final String APPROXIMATE_NUMBER_OF_MESSAGES_ATT = "ApproximateNumberOfMessages";
public static final String NAMESPACE = "QueueDepthNamespace";

Map<string string> attributes = sqs.getQueueAttributes(queueUrl, attributeList).getAttributes();
double approximateNumOfMsg = Double.parseDouble(attributes.get(APPROXIMATE_NUMBER_OF_MESSAGES_ATT));
And the second step is to publish the metric:
MetricDatum md = new MetricDatum()
  .withMetricName(queueName + "-OneMinute-" + APPROXIMATE_NUMBER_OF_MESSAGES_ATT)
  .withUnit(StandardUnit.Count)
  .withValue(approximateNumOfMsg);

cloudWatch.putMetricData(new PutMetricDataRequest()
  .withNamespace(NAMESPACE)
  .withMetricData(md));
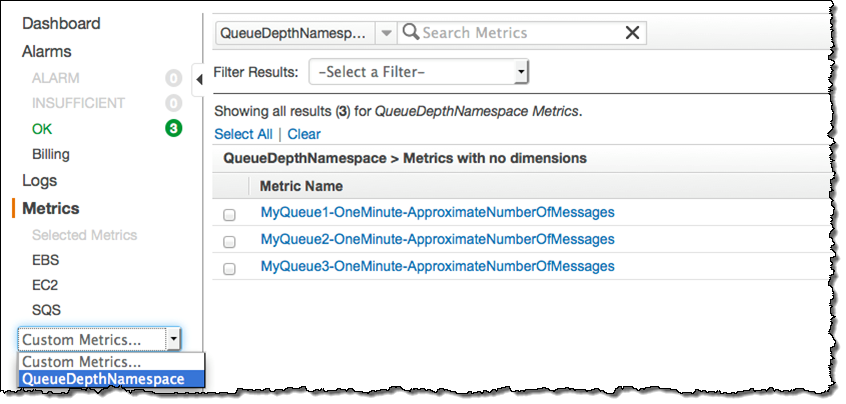
Although the queue’s metric is updated at one minute intervals, you should plan on collecting and publishing several samples per minute. This will provide enough data points to allow Auto Scaling to respond to changes more quickly and more accurately. For example, if you sample and publish every 10 seconds, each one-minute metric will reflect the average of six samples. Before choosing a sampling rate, be sure to do some calculations in order to make sure that you understand the per-call costs for the SQS and CloudWatch API functions. The metrics will be visible in the CloudWatch console:

The Worker Group will vary in size in response to changes in the custom metric published by the EC2 instance running in the Checker Group. To do this, you must associate CloudWatch alarms with the custom metrics. For example, you could use three alarms, configured as follows (you’ll need to fine-tune these to the needs of your application):
- MyQueue1-QueueDepthPassLowThreshold – When MyQueue1 accumulates a message backlog of 1000 messages, increase the size of the Worker Group by one instance.
- MyQueue1-QueueDepthPassHighThreshold – When MyQueue1 accumulates a message backlog of 1500 messages, increase the size of the Worker Group by two instances.
- MyQueue1-QueueDepthBelowSafeThreshold – When the number of messages in MyQueue1 is below 100, reduce the size of the Work Group by one instance.
Here’s how these alarms would look in the console:

Learning More
To learn more, read my blog post Additional CloudWatch Metrics for Amazon SQS and Amazon SNS and the documentation on Monitoring Amazon SQS With CloudWatch.
— Jeff;
