AWS News Blog
Store and Monitor OS & Application Log Files with Amazon CloudWatch
When you move from a static operating environment to a dynamically scaled, cloud-powered environment, you need to take a fresh look at your model for capturing, storing, and analyzing the log files produced by your operating system and your applications. Because instances come and go, storing them locally for the long term is simply not appropriate. When running at scale, simply finding storage space for new log files and managing expiration of older ones can become a chore. Further, there’s often actionable information buried within those files. Failures, even if they are one in a million or one in a billion, represent opportunities to increase the reliability of your system and to improve the customer experience.
Today we are introducing a powerful new log storage and monitoring feature for Amazon CloudWatch. You can now route your operating system, application, and custom log files to CloudWatch, where they will be stored in durable fashion for as long as you’d like. You can also configure CloudWatch to monitor the incoming log entries for any desired symbols or messages and to surface the results as CloudWatch metrics. You could, for example, monitor your web server’s log files for 404 errors to detect bad inbound links or 503 errors to detect a possible overload condition. You could monitor your Linux server log files to detect resource depletion issues such as a lack of swap space or file descriptors. You can even use the metrics to raise alarms or to initiate Auto Scaling activities.
Vocabulary Lesson
Before we dig any deeper, let’s agree on some basic terminology! Here are some new terms that you will need to understand in order to use CloudWatch to store and monitor your logs:
-
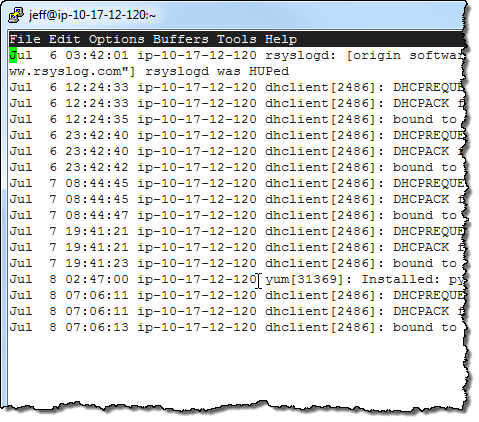 Log Event – A Log Event is an activity recorded by the application or resource being monitored. It contains a timestamp and raw message data in UTF-8 form.
 - Log Stream – A Log Stream is a sequence of Log Events from the same source (a particular application instance or resource).
- Log Group – A Log Group is a group of Log Streams that share the same properties, policies, and access controls.
- Metric Filters – The Metric Filters tell CloudWatch how to extract metric observations from ingested events and turn them in to CloudWatch metrics.
- Retention Policies – The Retention Policies determine how long events are retained. Policies are assigned to Log Groups and apply to all of the Log Streams in the group.
- Log Agent – You can install CloudWatch Log Agents on your EC2 instances and direct them to store Log Events in CloudWatch. The Agent has been tested on the Amazon Linux AMIs and the Ubuntu AMIs. If you are running Microsoft Windows, you can configure the ec2config service on your instance to send systems logs to CloudWatch. To learn more about this option, read the documentation on Configuring a Windows Instance Using the EC2Config Service.
Getting Started With CloudWatch Logs
In order to learn more about CloudWatch Logs, I installed the CloudWatch Log Agent on the EC2 instance that I am using to write this blog post! I started by downloading the install script:
$ wget https://s3.amazonaws.com/aws-cloudwatch/downloads/awslogs-agent-setup-v1.0.py
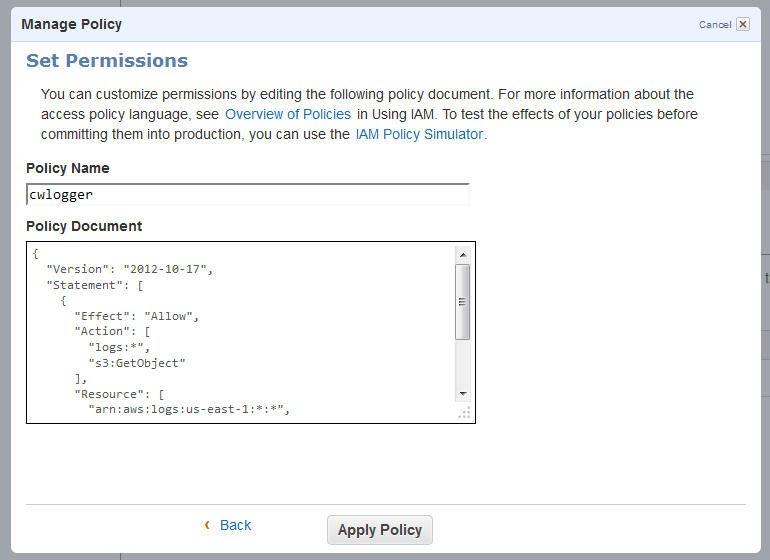
Then I created an IAM user using the policy document provided in the documentation and saved the credentials:
I ran the installation script. The script downloaded, installed, and configured the AWS CLI for me (including a prompt for AWS credentials for my IAM user), and then walked me through the process of configuring the Log Agent to capture Log Events from the /var/log/messages and /var/log/secure files on the instance:
Path of log file to upload [/var/log/messages]:
Destination Log Group name [/var/log/messages]:

Choose Log Stream name:
  1. Use EC2 instance id.
  2. Use hostname.
  3. Custom.
Enter choice [1]:

Choose Log Event timestamp format:
  1. %b %d %H:%M:%S    (Dec 31 23:59:59)
  2. %d/%b/%Y:%H:%M:%S (10/Oct/2000:13:55:36)
  3. %Y-%m-%d %H:%M:%S (2008-09-08 11:52:54)
  4. Custom
Enter choice [1]: 1

Choose initial position of upload:
  1. From start of file.
  2. From end of file.
Enter choice [1]: 1
The Log Groups were visible in the AWS Management Console a few minutes later:
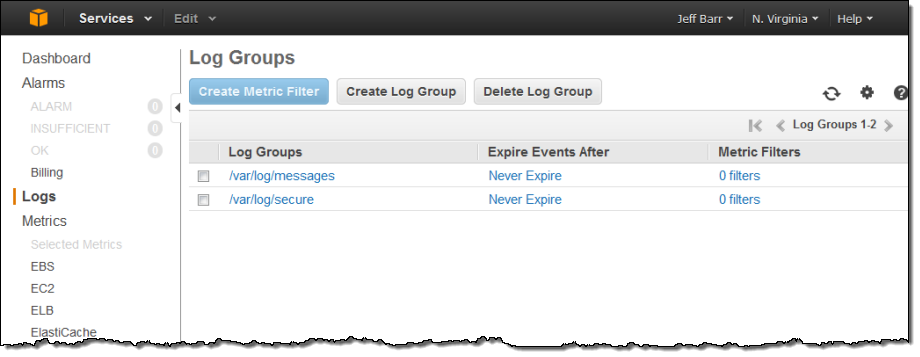
Since I installed the Log Agent on a single EC2 instance, each Log Group contained a single Log Stream. As I specified when I installed the Log Agent, the instance id was used to name the stream:

The Log Stream for /var/log/secure was visible with another click:
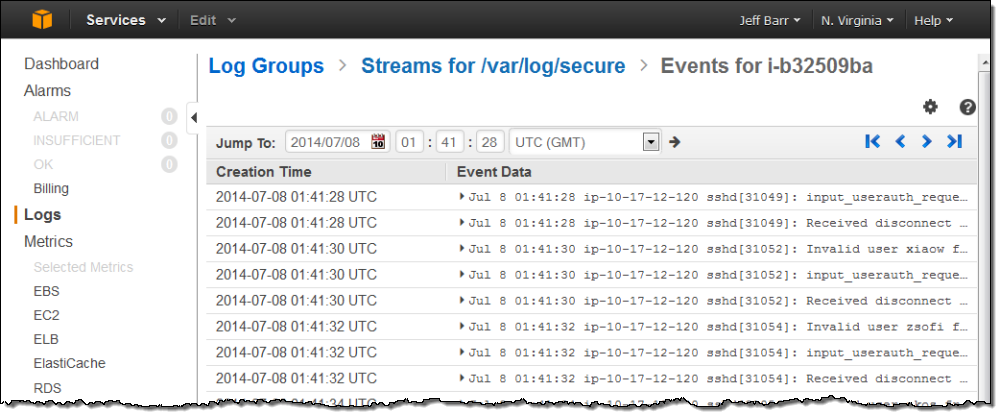
I decided to track the “Invalid user” messages so that I could see how often spurious login attempts were made on my instance. I returned to the list of Log Groups, selected the stream, and clicked on Create Metric Filter. Then I created a filter that would look for the string “Invalid user” (the patterns are case-sensitive):
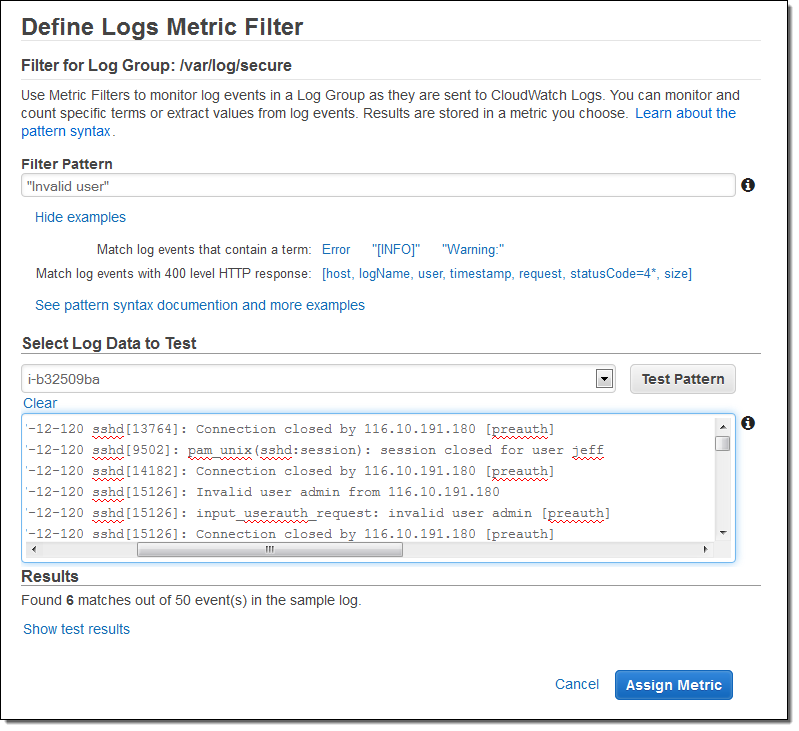
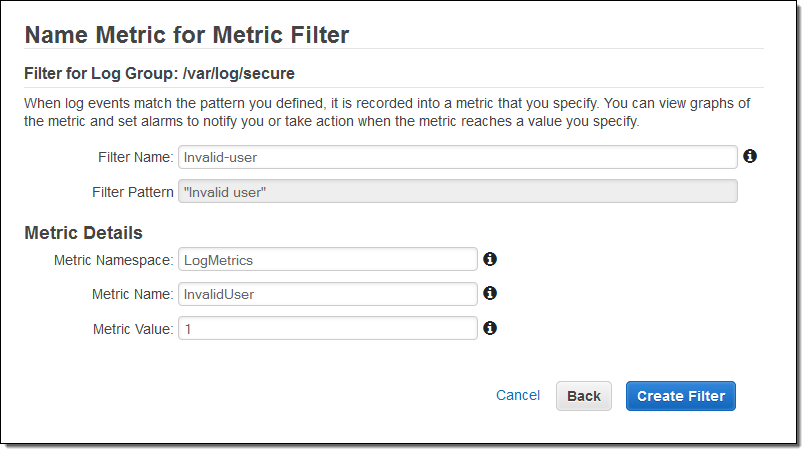
As you can see, the console allowed me to test potential filter patterns against actual log data. When I inspected the results, I realized that a single login attempt would generate several entries in the log file. I was fine with this, and stepped ahead, named the filter and mapped it to a CloudWatch namespace and metric:
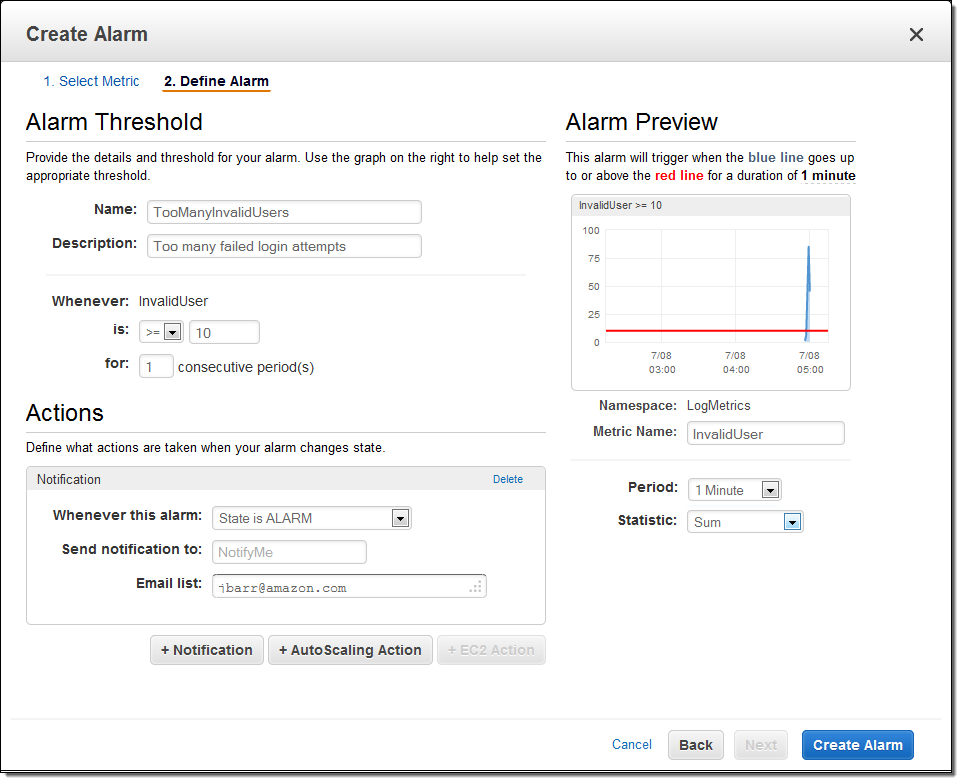
I also created an alarm to send me an email heads-up if the number of invalid login attempts grows to a suspiciously high level:
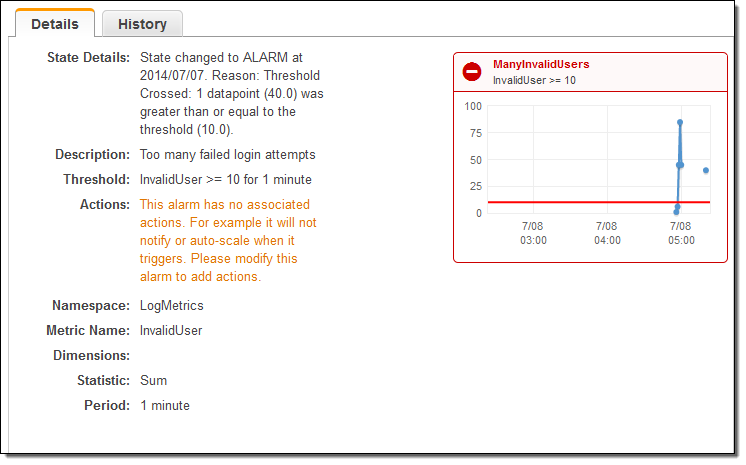
With the logging and the alarm in place, I fired off a volley of spurious login attempts from another EC2 instance and waited for the alarm to fire, as expected:
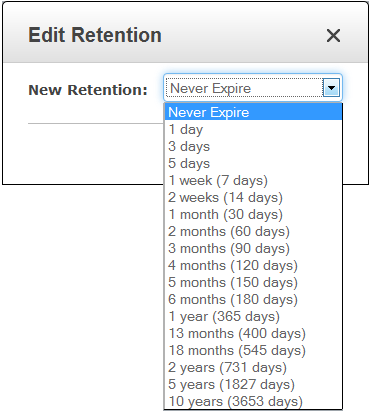
I also have control over the retention period for each Log Group. As you can see, logs can be retained forever (see my notes on Pricing and Availability to learn more about the cost associated with doing this):
Elastic Beanstalk and CloudWatch Logs
You can also generate CloudWatch Logs from your Elastic Beanstalk applications. To get you going with a running start, we have created a sample configuration file that you can copy to the .ebextensions directory at the root of your application. You can find the files at the following locations:
- Tomcat (Java) Configuration Files
- Apache (PHP and Python) Configuration Files
- Nginx (Ruby, Node.js, and Docker) Configuration Files
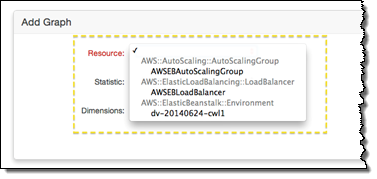
Place CWLogsApache-us-east-1.zip in the folder, then build and deploy your application as normal. Click on the Monitoring tab in the Elastic Beanstalk Console, and then press the Edit button to locate the new resource and select it for monitoring and graphing:
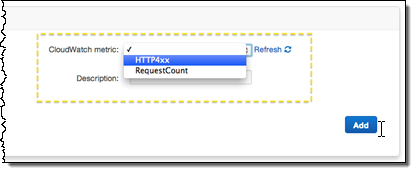
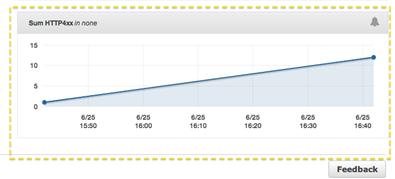
Add the desired statistic, and Elastic Beanstalk will display the graph:
To learn more, read about Using AWS Elastic Beanstalk with Amazon CloudWatch Logs.
Other Logging Options
You can push log data to CloudWatch from AWS OpsWorks, or through the CloudWatch APIs. You can also configure and use logs using AWS CloudFormation.
In a new post on the AWS Application Management Blog, Using Amazon CloudWatch Logs with AWS OpsWorks, my colleague Chris Barclay shows you how to use Chef recipes to create a scalable, centralized logging solution with nothing more than a couple of simple recipes.
To learn more about configuring and using CloudWatch Logs and Metrics Filters through CloudFormation, take a look at the Amazon CloudWatch Logs Sample. Here’s an excerpt from the template:
"404MetricFilter": {
    "Type": "AWS::Logs::MetricFilter",
    "Properties": {
        "LogGroupName": {
            "Ref": "WebServerLogGroup"
        },
        "FilterPattern": "[ip, identity, user_id, timestamp, request, status_code = 404, size, ...]",
        "MetricTransformations": [
            {
                "MetricValue": "1",
                "MetricNamespace": "test/404s",
                "MetricName": "test404Count"
            }
        ]
    }
}
Your code can push a single Log Event to a Long Stream using the putLogEvents function. Here’s a PHP snippet to get you started:
$result = $client->putLogEvents(array(
    'logGroupName'  => 'AppLog,
    'logStreamName' => 'ThisInstance',
    'logEvents'     => array(
        array(
            'timestamp' => round(microtime(true) * 1000),
            'message'   => 'Click!',
        )
    ),
    'sequenceToken' => 'string',
));
Pricing and Availability
This new feature is available now in US East (Northern Virginia) Region and you can start using it today.
Pricing is based on the volume of Log Entries that you store and how long you choose to retain them. For more information, please take a look at the CloudWatch Pricing page. Log Events are stored in compressed fashion to reduce storage charges; there is 26 bytes of storage overhead per Log Event.
— Jeff;