AWS News Blog
New – Enhanced Monitoring for Amazon RDS (MySQL 5.6, MariaDB, and Aurora)
Amazon Relational Database Service (Amazon RDS) makes it easy for you to set up, run, scale, and maintain a relational database. As is often the case with the high-level AWS model, we take care of all of the details in order to give you the time to focus on your application and your business.
Enhanced Monitoring
Advanced RDS users have asked us for more insight into the inner workings of the service and we are happy to oblige with a new Enhanced Monitoring feature!
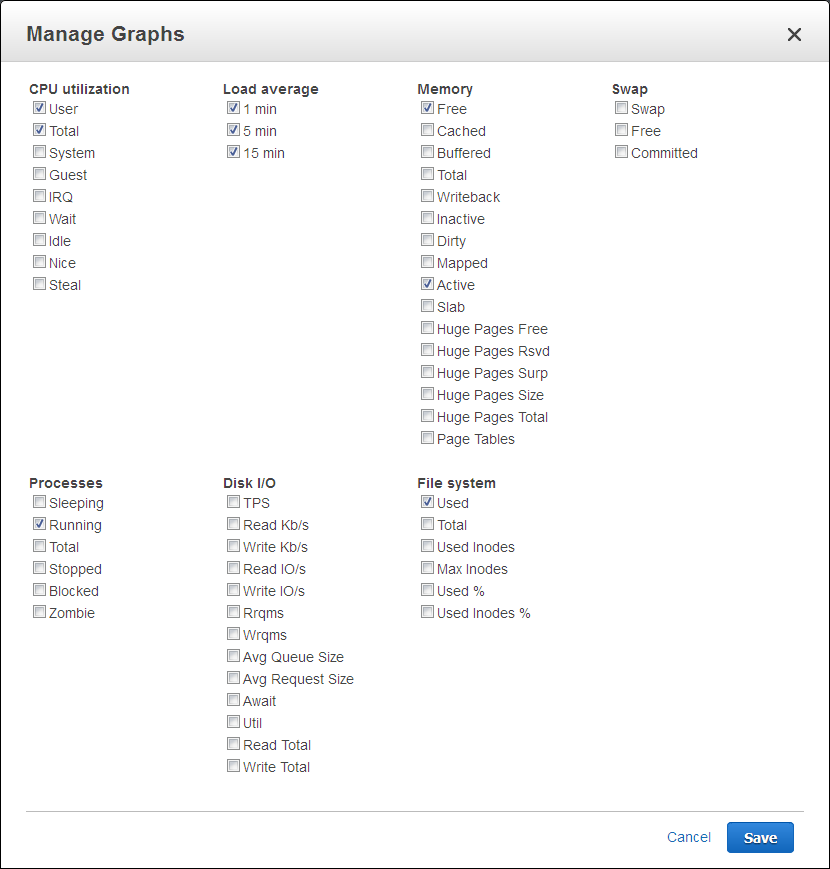
After you enable this feature for a database instance, you get access to over 50 new CPU, memory, file system, and disk I/O metrics. You can enable these features on a per-instance basis, and you can choose the granularity (all the way down to 1 second). Here is the list of available metrics:

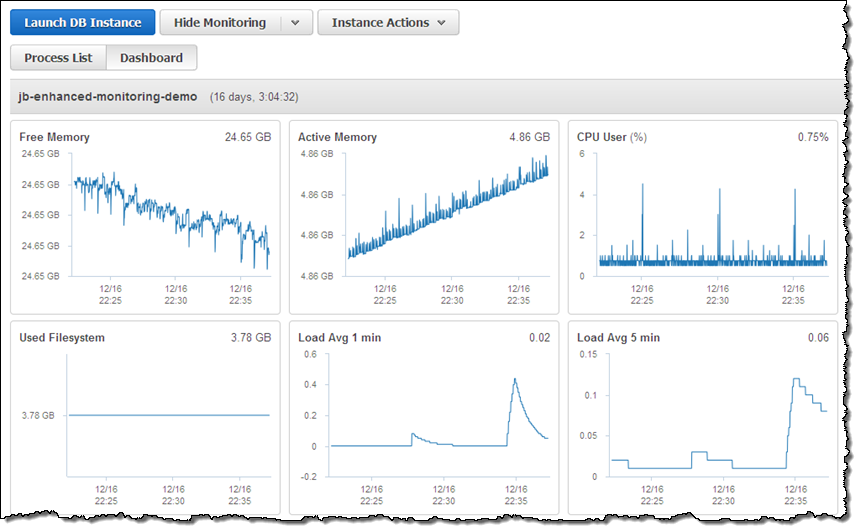
And here are some of the metrics for one of my database instances:

You can enable this feature for an existing database instance by selecting the instance in the RDS Console and then choosing Modify from the Instance Options menu:

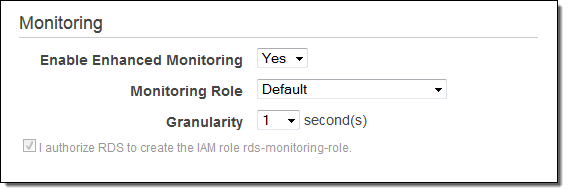
Turn the feature on, pick an IAM role, select the desired granularity, check Apply Immediately, and then click on Continue.
The Enhanced Metrics are ingested into CloudWatch Logs and can be published to Amazon CloudWatch. To do this you will need to set up a metrics extraction filter; read about Monitoring Logs to learn more. Once the metrics are stored in CloudWatch Logs, they can also be processed by third-party analysis and monitoring tools.
Available Now
The new Enhanced Metrics feature is available today in the US East (N. Virginia), US West (N. California), US West (Oregon), Europe (Ireland), Europe (Frankfurt), Asia Pacific (Singapore), Asia Pacific (Sydney), and Asia Pacific (Tokyo) regions. It works for MySQL 5.6, MariaDB, and Amazon Aurora, on all instance types except t1.micro and m1.small.
You will pay the usual ingestion and data transfer charges for CloudWatch Logs (see the CloudWatch Logs Pricing page for more info).
— Jeff;